FullStack Alpha logoBestAITradingTools.comby FullStack Alpha
Red and green candlestick chart recovering after a pullback on a dark background

CAN SLIM Growth Investing

IBD CAN SLIM Tools, Weekly Research, and Lower-Cost Options

  • CAN SLIM Growth Investing
  • Position Trading
  • Swing Trading (SwingTrader service)

IBD teaches CAN SLIM, a growth-stock process that pairs earnings and sales research with relative strength, chart bases, and a market-direction check before any buy. Here is the research stack its presenters use, and the tools that can do parts of the same jobs.

Investor's Business Daily is an organization channel (@investorsbusinessdaily, joined Oct 27, 2008). Methods on this page are credited to the presenters who taught them: Mike Webster, David Ryan, Alissa Coram, Dr. Thomas Carr, and Justin Nielsen. Channel https://www.youtube.com/@investorsbusinessdaily · official https://investors.com

William J. O'Neil, founder of Investor's Business Daily and creator of CAN SLIM

William J. O'Neil (1933 to 2023), IBD founder. He does not present the current videos referenced on this page.

Subscribers

184K subscribers · 2026

Public statement, not verified

Investor's Business Daily was founded by William O'Neil in 1984; CAN SLIM is his growth-stock method (company history).


Entity

organization

Investor's Business Daily (CAN SLIM) by the Numbers

Subscribers

184K

Channel views

37.3M

Videos

5,448

On YouTube since

2008

Avg views per video

about 6,800

Stack range

$0 to $168.95/mo

Did you know?

5,448 videos since 2008, one of the biggest libraries on this site.

Avg views per video is total channel views divided by public video count, the channel average. Stack range runs from the Free Start bundle to the priciest bundle. All figures 2026.

What Is Investor's Business Daily (CAN SLIM)'s Trading Style?

Market focus

U.S. growth stocks.

Holding period

Weeks to months.

Preferred conditions

A confirmed market uptrend, strong earnings and sales growth, high relative strength, and a breakout from a proper base.

What Setups Does Investor's Business Daily (CAN SLIM) Teach?

Cup with handle buy point (official IBD education)

Prior advance and a constructive base; the 2024 checklist calls for at least seven weeks and 15% to 30% depth. Double bottom (2024 checklist): at least seven weeks, depth no more than 40%, buy ten cents above the middle peak.

The 5% buy zone is not permission to buy any chart without the market and earnings checks. More source: https://www.investors.com/how-to-invest/investors-corner/how-to-buy-stocks-lam-research-cup-with-handle-launched-75-percent-advance/

Entry
Buy ten cents above the handle peak, within 5% of the proper pivot, with volume confirmation.

Sell rules, two frameworks

CAN SLIM growth position (official IBD education)

Cut a loss at 7% to 8% below your actual purchase price, not from the peak. Default partial profit zone 20% to 25%. Exception: a stock that gains at least 20% in the first one to three weeks after a breakout is held at least eight weeks, then reassessed.

SwingTrader (2025 guide)

Losses commonly cut at 2% to 3%; profit objectives commonly 5% to 10%; most holds five to ten days.

Two different services, two different rules. Do not mix them. Sources: https://www.investors.com/how-to-invest/investors-corner/when-to-take-profits-in-stocks-knowing-right-time-is-key-to-learning-how-to-invest/ · https://get.investors.com/wp-content/uploads/2025/01/How-To-Use-SwingTrader-2025.pdf

Technical exit (Alissa Coram, 2019)

Technical damage can count even when fundamentals still look good. More source: https://www.youtube.com/watch?v=xcB0PbzBrRA&t=89s

Exit
On a daily chart, a break of the 50-day line on heavy volume; for longer-term holders, a weekly close below the 10-week line on strong weekly volume.

Market direction (Mike Webster, 2020; official 2024 checklist)

Check the market stance, follow-through days, and distribution before adding exposure, then pick an exposure band.

A follow-through day does not guarantee the rally survives. More source: https://get.investors.com/wp-content/uploads/2024/08/IBDD-How-to-buy-Stocks-infographic.pdf

What Is Investor's Business Daily (CAN SLIM)'s Daily Trading Routine?

  1. STEP 01

    Weekend · David Ryan, 2022

    Inspect market and industry groups, daily and weekly charts; refresh and prune lists into a prioritized watchlist, not forced purchases.

    As taught by Investor's Business Daily (CAN SLIM) · Source

  2. STEP 02

    Previous evening · Stock Market Today

    Review index and leader action and position status; update candidate levels.

    As taught by Investor's Business Daily (CAN SLIM) · Source

  3. STEP 03

    Before a new investment · Mike Webster, 2020; 2024 checklist

    Check the market assessment and upcoming earnings; set the buy zone and loss point; hold, prepare a conditional plan, or pass.

    As taught by Investor's Business Daily (CAN SLIM) · Source

  4. STEP 04

    Market open

    Act on a valid breakout alert or a position issue. No mandatory first-hour trading block found in the reviewed material.

    As taught by Investor's Business Daily (CAN SLIM)

  5. STEP 05

    Midday

    No fixed midday routine found in the reviewed material. Optional alert or position check.

    As taught by Investor's Business Daily (CAN SLIM)

  6. STEP 06

    Market close · Stock Market Today; Alissa Coram

    Assess daily index and stock charts; check heavy-volume breaks, exposure, and positions.

    As taught by Investor's Business Daily (CAN SLIM) · Source

  7. STEP 07

    Ongoing position · official IBD education

    Monitor the loss rule from actual cost, the profit zone, 50-day and 10-week support, and earnings dates; hold, trim, exit, or consider a qualified add.

    As taught by Investor's Business Daily (CAN SLIM) · Source

  8. STEP 08

    SwingTrader members, each morning · 2025 guide

    Check Market Action and Current Trades, then buy zone, objective, and stop; receive trade updates (guide pages 3 to 4).

    As taught by Investor's Business Daily (CAN SLIM) · Source

  9. STEP 09

    Weekly portfolio review · David Ryan, 2022

    Compare holdings with current market and leader strength; prune weak candidates; set next week's list. No fixed daily review time or portfolio size was published for the whole organization.

    As taught by Investor's Business Daily (CAN SLIM) · Source

The Full Stack

What Is in Investor's Business Daily (CAN SLIM)'s Trading Stack?

Their pick on the left. Same job, different tool on the right. Prices sit side by side so you can do the math.

Scanner recipe

CAN SLIM, letter by letter

Three blocks, kept separate: A is current published criteria (2024 checklist and 2026 lessons), B is one presenter's screen, C is historical thresholds. Never merge the 2026 and historical numbers.

  1. 01A · C, current earnings: recent quarterly EPS growth of at least 25%; check sales growth and acceleration, not only a headline beat.▶ Source▶ 1:00
  2. 02A · A, annual earnings: strong multi-year earnings growth; the 2024 checklist repeats the growth and ROE benchmarks.▶ Source
  3. 03A · N, something new: a new product, service, or other material business change, with price emerging from a proper base or new-high context.▶ Source
  4. 04A · S, supply and demand: check shares, trading participation, and volume confirmation for signs of accumulation. This is not a small-float day-trading rule.▶ 1:59
  5. 05A · L, leader or laggard: compare stock and industry strength. The 2026 ratings lesson says an RS Rating below 80 usually lacks the breakout leadership IBD looks for.▶ 2:29
  6. 06A · I, institutional sponsorship: look for improving fund ownership and accumulation. No universal minimum number of owners was found in the official material.▶ 3:25
  7. 07A · M, market direction: check broad-market price and volume, leading stocks, distribution, and IBD's exposure guidance before adding holdings.▶ Source▶ 1:18▶ 0:00
  8. 08B · Dr. Thomas Carr's Smart Money screen (MarketSurge, Justin Nielsen assists, 2026). One presenter's screen, not a company-wide default. Price above $15.▶ 1:29
  9. 09B · 50-day average share volume above 500,000 (optionally raised to 1 million).▶ 1:59
  10. 10B · Industry group rating A.▶ 2:23
  11. 11B · Weekly volume change vs 10-week average above 10%.▶ 2:56
  12. 12B · Accumulation/Distribution rating A.▶ 3:25
  13. 13B · Composite Rating above 85.▶ 3:52
  14. 14B · Then sort by Composite or SMR.▶ 4:10
  15. 15C · HISTORICAL 2008, 20 Rules booklet. Older official education, shown for reference, not as current IBD formulas. Annual earnings growth of at least 25% in each of the previous three years; ROE at least 17%.▶ Source
  16. 16C · HISTORICAL 2008. RS Rating at least 85; Composite Rating at least 90.▶ Source

IBD's RS Rating is proprietary. It is a percentile ranking against IBD's own stock universe, not RSI and not relative volume. A free screener's performance column is not the IBD RS Rating. IBD revised its ratings in 2026: more weight on the latest three quarters in the EPS Rating, a revised SMR and Composite approach, and an Accumulation/Distribution calculation using a 21-day ATR and closing range. Older formulas are not the current ratings. Industry group A and A/D A are proprietary ratings. Picking a sector name or a single high-volume day on a free screener does not reproduce them. In the tools below, proprietary IBD fields (RS, Composite, SMR, A/D, group rating) will show as unavailable. Mark them unknown rather than substituting a different metric.▶ 1:41

Load this recipe into

LAYER 01Screening and Ratings

Their pick

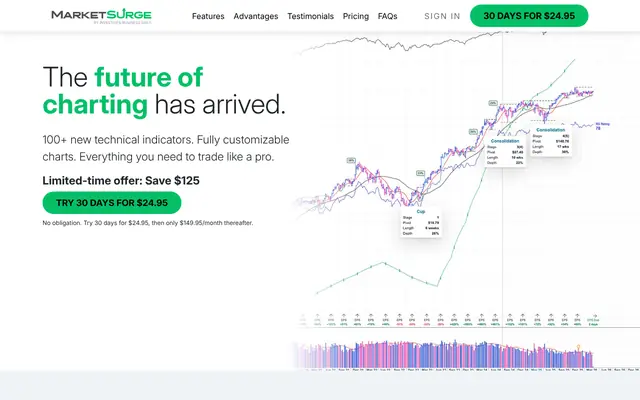
MarketSurge (IBD's growth research platform) official site
Official site · Oct 2026
MarketSurge (IBD's growth research platform) logo

MarketSurge (IBD's growth research platform)

USED 2026MADE BY IBD

$149.95/mo or $1,499/yr ($124.92/mo equivalent)

Intro offers run $24.95 for 30 days or $49.95 for 6 weeks, then it renews at $149.95/mo.

Why they use it. Dr. Thomas Carr builds his Smart Money screen inside it, filtering directly on IBD's proprietary ratings.

Check Price

Affiliate link

Their pick

MarketSmith iPad app logo

MarketSmith iPad app

HISTORICAL 2022

Now MarketSurge

No separate price; renamed MarketSurge on March 4, 2024.

Why they use it. David Ryan's weekly screen: favorites, the MarketSmith 250 list, and industry-group ordering.

Same job, different tool

IBD Digital (MADE BY IBD) logo

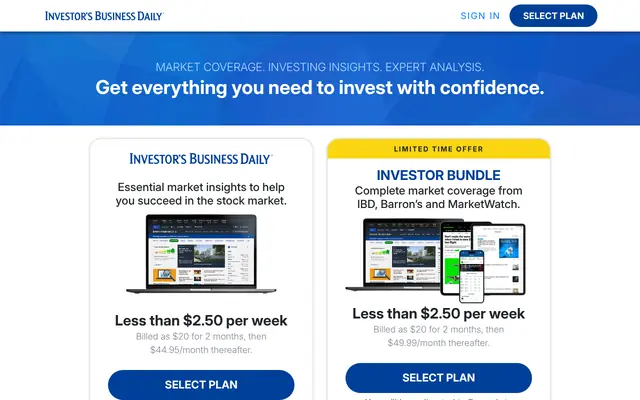
IBD Digital (MADE BY IBD)

PARTIAL MATCH

$38.95 to $44.95/mo depending on the offer, or $379/yr (intro deals from $10 to $20 for the first 2 months are not the recurring price)

Replaces. Access to IBD ratings and stock lists through a different IBD product tier

What you give up. Different advanced chart and pattern features than MarketSurge

Check Price

Affiliate link

Why price varies: IBD's listed price differs by offer and checkout. Confirm at checkout.

Same job, different tool

Finviz Free logo

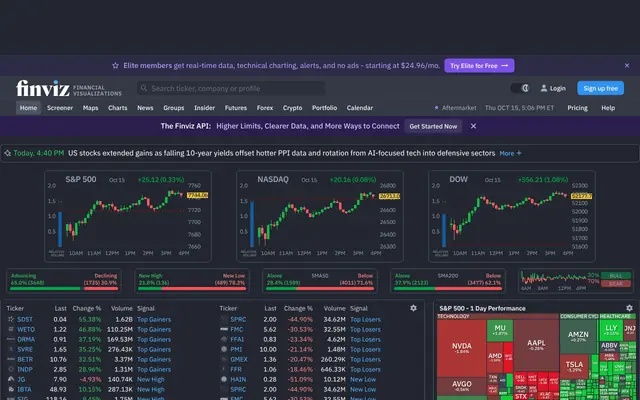
Finviz Free

PARTIAL MATCH

$0

Replaces. EPS, sales, ROE, and price-volume candidate screening

What you give up. No IBD EPS, RS, SMR, Composite, or A/D ratings; stock quotes delayed one minute; figures need checking against filings

Check Price

Affiliate link

Read our review

Same job, different tool

Finviz Elite logo

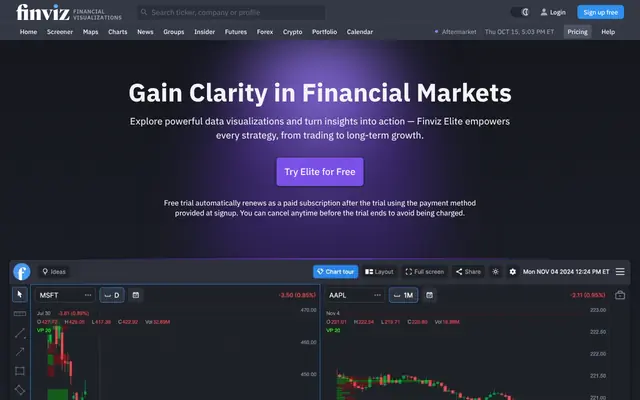
Finviz Elite

PARTIAL MATCH

$39.50/mo or $299.50/yr ($24.96/mo equivalent)

Replaces. The same screen with real-time stock quotes, extended hours, exports, and push alerts

What you give up. No IBD proprietary ratings or IBD base recognition; fundamentals update hourly

Check Price

Affiliate link

Read our review

Keeping MarketSurge makes sense if you want IBD's current proprietary ratings, industry rankings, pattern recognition, and one research workspace. The alternatives rebuild parts of the screen. None of them reproduces IBD's ratings database.

LAYER 02Research and Earnings

Their pick

IBD SmartSelect ratings and Stock Checkup (EPS, RS, SMR, Composite, A/D, and group ratings) logo

IBD SmartSelect ratings and Stock Checkup (EPS, RS, SMR, Composite, A/D, and group ratings)

USED 2026MADE BY IBD

Included with MarketSurge or IBD Digital, depending on product

Why they use it. Compares business and stock quality against IBD's whole stock universe in one view.

Same job, different tool

SEC EDGAR + company investor relations pages logo

SEC EDGAR + company investor relations pages

PARTIAL MATCH

$0

Replaces. Reported EPS, sales, and guidance from the primary source

What you give up. Manual normalization, long filings, no proprietary ratings, no instant all-stock ranking

Check Price

Affiliate link

Research method: compare the reported quarter with the year-ago quarter, keep EPS and sales separate from guidance, and record the source and date. FullStack Alpha implementation of the published criteria, not an official IBD procedure.

Same job, different tool

Claude Pro logo

Claude Pro

COMPANIONAI

$20/mo or $200/yr ($16.67/mo equivalent)

Replaces. Organizing a dated, source-linked earnings comparison

What you give up. Does not calculate IBD ratings; you still check every figure against the filing

What the AI actually does. Extracts earnings figures from filings you attach, with source citations, and flags missing data

Check Price

Affiliate link

IBD's ratings are proprietary. No tool on this page recreates them. The alternatives give you the raw earnings and sales data to judge yourself.

LAYER 03Charts and Buy Points

Their pick

MarketSurge charts, pattern detection, and alerts official site
Official site · Oct 2026
MarketSurge charts, pattern detection, and alerts logo

MarketSurge charts, pattern detection, and alerts

USED 2026MADE BY IBD

Same subscription, $0 extra

David Ryan toggling daily and weekly charts, 2022, MarketSmith. Pattern detection is an algorithmic feature, not a generative-AI coach, and a detected pattern is not a guaranteed breakout.

Why they use it. Daily and weekly charts with base and pivot marking, so buy points and loss points are planned before the order.

Their pick

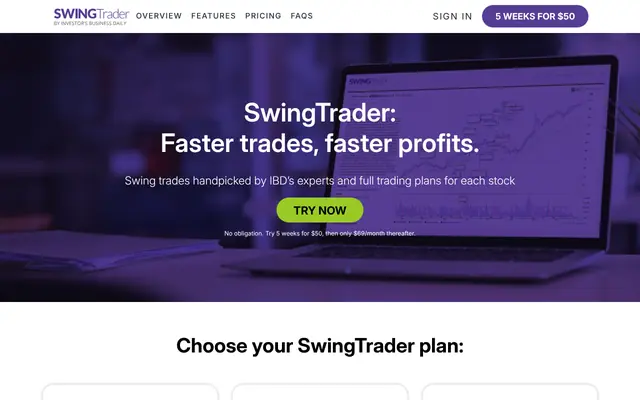
SwingTrader (separate service) official site
Official site · Oct 2026
SwingTrader (separate service) logo

SwingTrader (separate service)

MADE BY IBDCURRENT 2025 GUIDE

$69/mo or $699/yr ($58.25/mo equivalent)

Intro offers run $39 to $50 for the first 5 to 6 weeks, then it renews at $69/mo.

Optional. A separate five-to-ten-day swing service, not required for CAN SLIM growth investing. SwingTrader's trade plans are IBD's own picks. No tool on this page replaces them.

Why they use it. Specific short-hold trade plans with a buy zone, stop, and objective, plus desktop and mobile alerts.

Check Price

Affiliate link

Same job, different tool

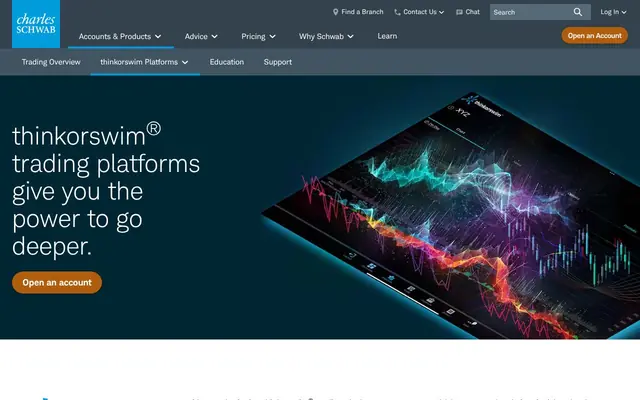
thinkorswim logo

thinkorswim

PARTIAL MATCH

A full match for basic chart functions

$0 for eligible Schwab clients

Replaces. Daily and weekly charts, levels, and alerts

What you give up. No IBD ratings, curated lists, database, or IBD base recognition; you mark bases and pivots yourself

Check Price

Affiliate link

Read our review

LAYER 04Market Direction

Their pick

IBD Digital, The Big Picture, and IBD stock lists (IBD 50, growth and industry lists, market stance) official site
Official site · Oct 2026
IBD Digital, The Big Picture, and IBD stock lists (IBD 50, growth and industry lists, market stance) logo

IBD Digital, The Big Picture, and IBD stock lists (IBD 50, growth and industry lists, market stance)

MADE BY IBD

$38.95 to $44.95/mo depending on the offer, or $379/yr (intro deals from $10 to $20 for the first 2 months are not the recurring price)

Why they use it. Checks the market stance and exposure guidance before any new buy.

Check Price

Affiliate link

Their pick

Stock Market Today (public IBD video) logo

Stock Market Today (public IBD video)

USED 2026FREE RESOURCE

$0

The public video does not require a paid IBD Live subscription.

Why they use it. Justin Nielsen hosts and Mike Webster reviews index and leader action after the session.

Check Price

Affiliate link

Same job, different tool

Manual market log (thinkorswim index charts + LibreOffice Calc) logo

Manual market log (thinkorswim index charts + LibreOffice Calc)

PARTIAL MATCH

$0

Replaces. Recording index price, volume, and leader behavior each day

What you give up. No official IBD market stance or exposure call; you judge distribution and follow-through yourself

Check Price

Affiliate link

Read our review

IBD's framework exposure bands (2024 checklist): 0% to 20%, 20% to 40%, 40% to 60%, 60% to 80%, 80% to 100%. These are framework bands, not the market's actual exposure recommendation today. No AI tool for market direction was established in our research. This layer stays manual.

LAYER 05Execution

Their pick

No common broker found across the reviewed presenters.

AIThe AI alternative

Let rules or an AI agent place the trades through a broker API. Automation executes your plan faster; it doesn't make a bad plan good.

  • Alpaca

    Alpha Score 77/100

    API-first brokerage built for developers to build and deploy algorithmic trading strategies in equities and options.

    Read the reviewAI Trading Platform Finder

  • QuantConnect

    Alpha Score 65/100

    Cloud-based algorithmic trading platform with a backtesting engine, live trading across multiple brokerages, and a community strategy library.

    Read the reviewAI Trading Bot Finder

  • StockHero

    Alpha Score 64/100

    Cloud-based trading bot platform with prebuilt bot templates, paper trading, and multi-exchange support for automated crypto and stock strategies.

    Read the reviewAI Trading Bot Finder

IBD's research products do not place trades. Keep the broker that fits your account, and use your broker's quote for live order decisions.

Or the tools the other educators use for execution

Prices are subject to change fast, like AI technology.

Check before you switch

  1. 01Order control. Fast traders need hotkeys, attached stops and, for some, routing choice. Check that the platform lets you place and exit a trade in one or two keystrokes.
  2. 02Short access. If you short, availability and locate fees matter more than commissions. Ask how the broker handles hard-to-borrow stocks before you need one.
  3. 03The full fee picture. Commissions, platform fees, market data and locate fees all add up. Compare the monthly total at your real trade count, not the headline rate.
Compare every execution and brokers tool →

LAYER 06Journal and Review

Their pick

No shared journal app found in the reviewed IBD material.

Actual purchase pricePivot and baseMarket stanceEarnings datePlanned loss pointManagement decision

Suggested fields: FullStack Alpha fields drawn from IBD's documented decisions, not an official IBD journal template.

Same job, different tool

TradesViz Pro logo

TradesViz Pro

COMPANIONAI

$19.99/mo or $179/yr ($14.92/mo equivalent)

Replaces. Import, tagging, and holding-period comparison

What you give up. No CAN SLIM rating database or portfolio advice; check one imported day against your broker before migrating

What the AI actually does. AI Coach and grouped review of your imported trades by setup and holding period

Check Price

Affiliate link

Same job, different tool

TradesViz Basic logo

TradesViz Basic

COMPANION

$0

Replaces. Basic stock trade journal

What you give up. Stocks only, capped at 3,000 executions a month, no AI review

Check Price

Affiliate link

Same job, different tool

LibreOffice Calc trade log logo

LibreOffice Calc trade log

PARTIAL MATCH

$0

Replaces. The six fields above in a spreadsheet

What you give up. Everything is manual

Check Price

Affiliate link

LAYER 07AI Assist

Their pick

No generative AI tool established in the reviewed IBD material.

Same job, different tool

Claude Pro logo

Claude Pro

COMPANIONAI

$20/mo or $200/yr ($16.67/mo equivalent)

Replaces. Weekly research organization

What you give up. No live data; does not calculate IBD ratings or confirm a valid pivot without your inputs

What the AI actually does. Organizes your weekly watchlist notes and source-linked earnings summaries, and flags inconsistent records

Check Price

Affiliate link

Same subscription as Research and Earnings; the cart counts it once.

LAYER 08Gear

Prices are subject to change fast, like AI technology.

LAYER 09Gear

Their setup (dated)

  • iPad running the MarketSmith app, used by David Ryan for weekly screening

  • iPad paired with an external monitor in the same weekly routine

Exact iPad and monitor models not stated. Computers and desk setup were not found in the reviewed videos. A dated snapshot from their videos. You do not need this setup to use the strategy.

Starter trading desk with two monitors, a laptop and a leather chair in a dark study

Start smaller

IBD's presenters did not publish a beginner hardware list in the reviewed material. These are FullStack Alpha slots for a daily and weekly chart routine.▶ 0:04

Prices change daily on Amazon. Check each item's current price. Compare more in the Gear Lab

Ready-made stacks

Which IBD Stack Fits Your Budget?

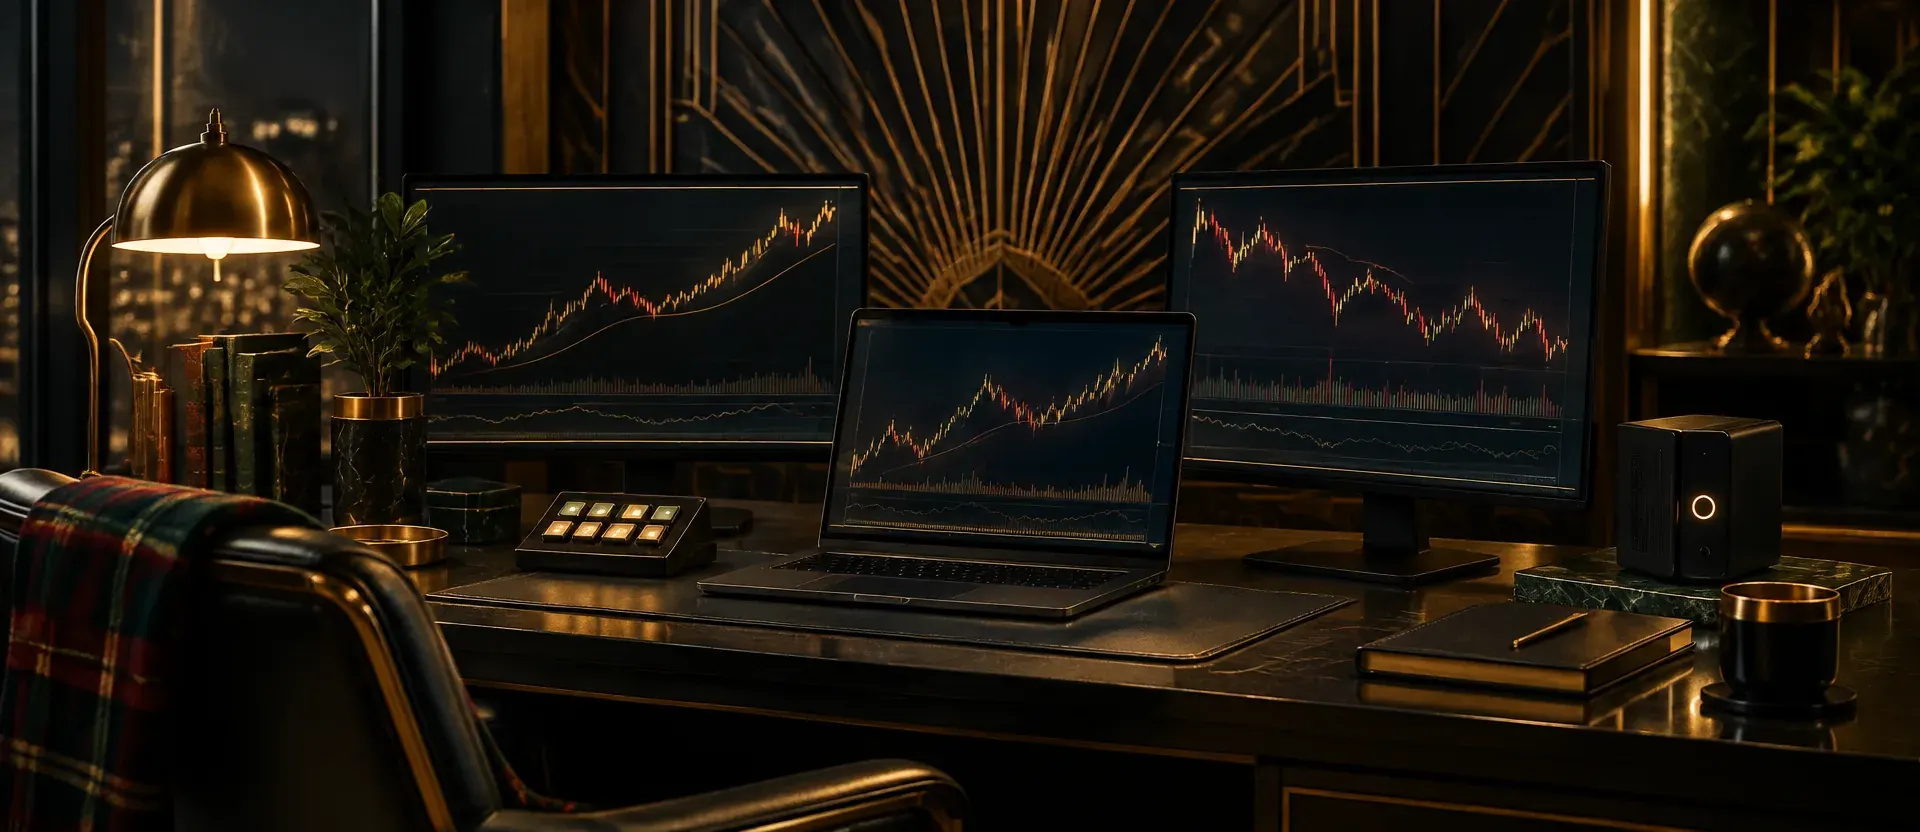
Dark Art Deco trading desk with three monitors showing price charts and a plaid chair

The AI Full Stack

The CAN SLIM Workflow, Rebuilt With AI Tools

Desk

  • Apple MacBook Air 13.6" M5, 16GB, 512GB$1,000 to $2,000
  • Acer SB242Y H1bi (x2)Under $100
  • VIVO STAND-V002 Dual MountUnder $100
  • Elgato Stream Deck MiniUnder $100

One-time. Swing Starter desk $200 to $300 + computer $1,000 to $2,000. Check current prices on Amazon. Gear Lab

Software

  • Finviz Elite logoFinviz EliteScreening and Ratings: screen and export; no AI itself, its export feeds Claude$39.50/mo
  • SEC EDGAR logoSEC EDGARResearch and Earnings: primary-source figures, read by Claude ProFree
  • thinkorswim logothinkorswimCharts and Buy Points, for eligible Schwab clients; no AIFree
  • Stock Market Today (public video) logoStock Market Today (public video)Market Direction: public video + manual log; no AI tool establishedFree
  • TradesViz Pro logoTradesViz ProJournal and Review: AI Coach$19.99/mo
  • Claude Pro logoClaude ProAI extraction with citations, research and review organization; counted once$20/mo

$79.49/mo month to month

$678.50/yr

Broker, market data, and commissions are separate. Keep your broker. No proprietary IBD ratings are included in this stack. This stack adds TradesViz Pro for AI journal review. The AI Research bundle below keeps a manual Calc journal, which is why their totals differ.

Built by FullStack Alpha from IBD's public CAN SLIM education. Not used or endorsed by Investor's Business Daily.

Known subtotal: $678.50/yr ($56.54/mo equivalent). TradesViz annual is the current advertised offer. Execution stays with your existing broker, not counted.

  • Free Start

    $0/mo

    • Finviz Free logoFinviz Free$0
    • thinkorswim logothinkorswim$0
    • SEC EDGAR logoSEC EDGAR$0
    • LibreOffice Calc logoLibreOffice Calc$0

    Stays manual. All fundamental research and source checks, market and index context, base and pivot marking

    Requires an eligible Schwab account. No proprietary IBD ratings or official exposure service.

  • AI Research

    OUR PICK

    $59.50/mo

    Or $499.50/yr ($41.63/mo equivalent) $499.50/yr ($41.63/mo equivalent)

    • Finviz Elite logoFinviz Elite$39.50
    • Claude Pro logoClaude Pro$20
    • thinkorswim logothinkorswim$0
    • SEC EDGAR logoSEC EDGAR$0
    • LibreOffice Calc logoLibreOffice Calc$0

    Stays manual. Checking source figures, market stance, base quality, and actual broker prices

    Still an approximation of IBD selection, not the IBD ratings.

  • IBD Research

    $169.94/mo

    Annual comparison $1,678/yr ($139.83/mo equivalent) $1,678/yr ($139.83/mo equivalent)

    • MarketSurge logoMarketSurge$149.95
    • TradesViz Pro logoTradesViz Pro$19.99

    Stays manual. Order entry through your broker, trade tagging

    Keeps IBD's proprietary ratings and pattern tools. Following the SwingTrader workflow? Add SwingTrader: $69/mo or $699/yr. With it: $238.94/mo, or $2,377/yr ($198.08/mo equivalent). SwingTrader is optional, not required for CAN SLIM growth investing.

Totals cover software and selected data only. Commissions, exchange fees, hardware, and taxes are not included. IBD Digital is left out of fixed totals because its listed price varies; confirm at checkout. TradesViz annual prices are current advertised offers. Prices checked 2026.

Find a tool like theirs

Not sure Investor's Business Daily (CAN SLIM)'s exact stack fits you? These two finders cover the tools closest to this routine. Answer five questions and get three matches.

What Broker, Scanner, and Charts Does Investor's Business Daily (CAN SLIM) Use?

What broker does Investor's Business Daily use?

Investor's Business Daily's broker is not named in the public videos we reviewed, so we do not guess. Keep the broker you already have if it covers the market and the data your routine needs.

What scanner does Investor's Business Daily use?

For scanning, Investor's Business Daily uses MarketSurge (IBD's growth research platform) (used in 2026; $149.95/mo or $1,499/yr ($124.92/mo equivalent)); MarketSmith iPad app (historical in 2022; Now MarketSurge).

Dr. Thomas Carr builds his Smart Money screen inside it, filtering directly on IBD's proprietary ratings. Same job, different tool: IBD Digital (MADE BY IBD) at $38.95 to $44.95/mo depending on the offer, or $379/yr (intro deals from $10 to $20 for the first 2 months are not the recurring price).

How much does it cost to trade like Investor's Business Daily?

The software stacks on this page run $0 to $168.95/mo. The cheapest, Free Start, is Finviz Free (screening) + thinkorswim (daily and weekly charts, execution) + SEC EDGAR and company IR (earnings) + LibreOffice Calc (watchlist and journal).

Our pick, AI Research, is Finviz Elite $39.50 + Claude Pro $20 + the Free Start broker and journal. Commissions, exchange fees, and hardware are separate. Prices checked 2026.

Does Investor's Business Daily use AI for trading?

No AI tool appears in Investor's Business Daily's public videos that we reviewed. The AI Full Stack on this page is FullStack Alpha's rebuild of the same routine, not Investor's Business Daily's own setup.

Which Investor's Business Daily (CAN SLIM) Videos Should You Watch First?

How To Set Up The "Smart Money" Screen On MarketSurge | IBD

5:20 · 2026

Dr. Thomas Carr builds IBD's Smart Money screen inside MarketSurge, filtering directly on IBD's proprietary ratings. The screen depends on a MarketSurge subscription, and the $24.95 trial is not the recurring price.

Watch on YouTube

IBD Ratings: How To Find Market Leaders And Top Quality Stocks

9:49 · 2026

IBD walks through its ratings, which compare a company's business and stock quality against IBD's whole stock universe in one view. These are proprietary fields, so a free screener or a single high-volume day will not reproduce them.

Watch on YouTube

Indexes Finish On A Positive Note; Datadog, Snowflake, Dell In Focus | Stock Market Today

64:50 · 2026

In this free Stock Market Today episode, Justin Nielsen hosts and Mike Webster reviews index and leader action after the session, with Datadog, Snowflake, and Dell in focus. Use it as an evening routine to check position status and update candidate levels.

Watch on YouTube

David Ryan Walks Through His Weekly Screening Routine | IBD Live

19:01 · 2022

David Ryan walks through his 2022 weekly screen on an iPad running MarketSmith, working favorites, the MarketSmith 250 list, and industry groups across daily and weekly charts. The goal is a pruned, prioritized watchlist with buy and loss points planned ahead, not forced purchases.

Watch on YouTube

Trader Education: IBD's Top Investing Rules For Beginners

15:01 · 2020

Mike Webster's 2020 beginner rules start with the market: check its stance, follow-through days, and distribution before adding exposure, then set a buy zone and loss point. A follow-through day does not guarantee the rally survives, so waiting or passing stays an option.

Watch on YouTube

Technical Analysis: Know These Sell Rules To Protect Your Profits

2:55 · 2019

Alissa Coram lays out IBD's technical sell rules: on a daily chart, a heavy-volume break of the 50-day line, and for longer-term holders, a weekly close below the 10-week line on strong volume. Technical damage counts even when fundamentals still look good.

Watch on YouTube

How To Buy Stocks: Psychology Of Chart Patterns

4:13 · 2018

IBD explains why bases form: after a run of 30% or more, late buyers get trapped in the pullback, institutions start buying to build the right side, and those trapped holders sell near breakeven on the way back up. The buy point is the prior resistance level, taken only when the stock clears it in heavy volume; buying the bottom of the base only looks smarter in hindsight.

Watch on YouTube

Build Your Watch List With A Simple Weekend Routine

No transcript reviewed

4:11 · 2018

IBD's four-minute 2018 video lays out a weekend routine for setting your action plan for the week ahead and updating your watch list. The video doesn't publish its steps in writing, so treat it as a nudge to finish your list before Monday, not a full method.

Watch on YouTube

Older videos teach rules that IBD has since revised in places. Dates are shown so you know which version you are watching.

What Order Should You Study Investor's Business Daily (CAN SLIM)'s Process In?

  1. Watch the foundation lesson

    Start with "Trader Education: IBD's Top Investing Rules For Beginners" before the advanced material. Open on YouTube

  2. Write the setups down

    Copy the 4 setup cards on this page into your own words: conditions, entry, exit, risk.

  3. Build the Free Start stack

    Finviz Free (screening) + thinkorswim (daily and weekly charts, execution) + SEC EDGAR and company IR (earnings) + LibreOffice Calc (watchlist and journal). Learn the process before you pay for speed. Load it in the Stack Builder

  4. Log 20 trades or paper trades

    Journal every one, including the bad ones. Your journal, not a video, decides what works for you.

  5. Upgrade to AI Research

    Finviz Elite $39.50 + Claude Pro $20 + the Free Start broker and journal. Add paid tools one layer at a time, starting with the job your journal says costs you most. Load it in the Stack Builder

A FullStack Alpha study order built from Investor's Business Daily (CAN SLIM)'s public lessons. Process beats prediction: master one layer before you pay for the next.

Where Does Each Investor's Business Daily (CAN SLIM) Claim Come From?

See all educator workflows

Incoming transmission | Free weekly newsletter

Stop paying for tools that don't earn their seat.

FullStack Alpha has tested 200 AI stock tools. Be honest: how many of yours do the same job, and which one did you forget you signed up for?

One email a week fixes that: which tools are worth the money, what they cost right now, and how the traders on this site wire them into a routine. Five minutes to read. Zero noise.

Free. One email a week. Unsubscribe in one click. We never sell your email.

  • Hot stock picks
  • Paid signal pitches
  • Fake countdown timers
  • Gurus selling courses

Inside every issue

5 MIN READ

  1. 01

    The Verdict

    One AI trading tool tested and scored. What it does well, what it costs, and the catch the sales page leaves out.

  2. 02

    Price Watch

    Price changes and live promos on the tools traders actually use, monthly and annual side by side, so you stop overpaying.

  3. 03

    Workflow Teardown

    One educator's routine taken apart: the scan, the chart, the tools, and the free swap for every paid one.

  4. 04

    Scan of the Week

    Exact scanner settings you can copy, pulled from the educator's own lesson with the timestamp.

Process beats prediction. This is the email that keeps your process honest.